
A hospital can spend $2 to $4 to collect every $100 of net patient revenue and still be within the accepted industry benchmark, yet top-performing organizations are targeting at or below 2% of net collections (HFMA benchmark summary via MBW RCM). The strategic problem isn't the existence of collection cost. It's the gap between what your organization is spending to get paid and what a disciplined revenue cycle should require.
That gap is where margin leaks hide. A weak cost-to-collect result rarely comes from a single billing issue. It usually reflects a chain of operational failures across registration, eligibility, coding, claim quality, denial prevention, follow-up, and payment posting. For leadership teams, that makes cost to collect one of the few revenue cycle metrics that translates directly into operating efficiency.
Table of Contents
- Why Every Healthcare Leader Needs to Master Cost to Collect
- Defining Cost to Collect in Your Revenue Cycle
- How to Accurately Calculate Your Cost to Collect
- Interpreting Cost to Collect Revenue Cycle Benchmarks
- The Primary Drivers of High Collection Costs
- Actionable Strategies to Lower Your Cost to Collect
- Your Next Step with Clarity Health RCM
Why Every Healthcare Leader Needs to Master Cost to Collect
The benchmark range is stable, but performance isn't. The accepted standard for cost to collect revenue cycle benchmarks remains 2% to 4% of net patient revenue, while top performers aim for ≤2% and a recent industry average cited by AKASA sits at 3.68% (benchmark analysis). That spread tells executives something important. Many organizations aren't losing money because reimbursement is impossible. They're losing money because the process of collecting earned revenue is too expensive.
Cost to collect is the closest thing healthcare finance has to a “cost of getting paid.” It asks a hard operational question: how much labor, technology, vendor spend, and rework does your organization require to convert earned revenue into cash? If the answer is drifting upward, your margin is being consumed by billing friction rather than clinical delivery.
Leaders often focus first on topline reimbursement and payer yield. That matters, but it can hide avoidable expense. Two organizations can collect similar revenue and deliver very different financial performance if one submits cleaner claims, works fewer denials, and posts payments with less manual effort.
Executive takeaway: Cost to collect is not just a billing metric. It's a management test of whether your revenue cycle converts administrative effort into cash efficiently.
This is why the metric belongs in leadership review, not just in the business office. A rising figure can indicate weak front-end discipline, fragmented mid-cycle controls, or an accounts receivable team buried in preventable rework. A lower figure usually reflects something healthier: cleaner intake, fewer claim corrections, more productive workflows, and better use of staff time.
Defining Cost to Collect in Your Revenue Cycle
Cost to collect measures the administrative cost of turning earned revenue into cash
In healthcare finance, cost to collect functions much like cost of goods sold in other industries. It quantifies how much administrative expense the organization incurs to convert billed services into cash. The standard expression is straightforward: total revenue cycle expense divided by total collections, multiplied by 100.
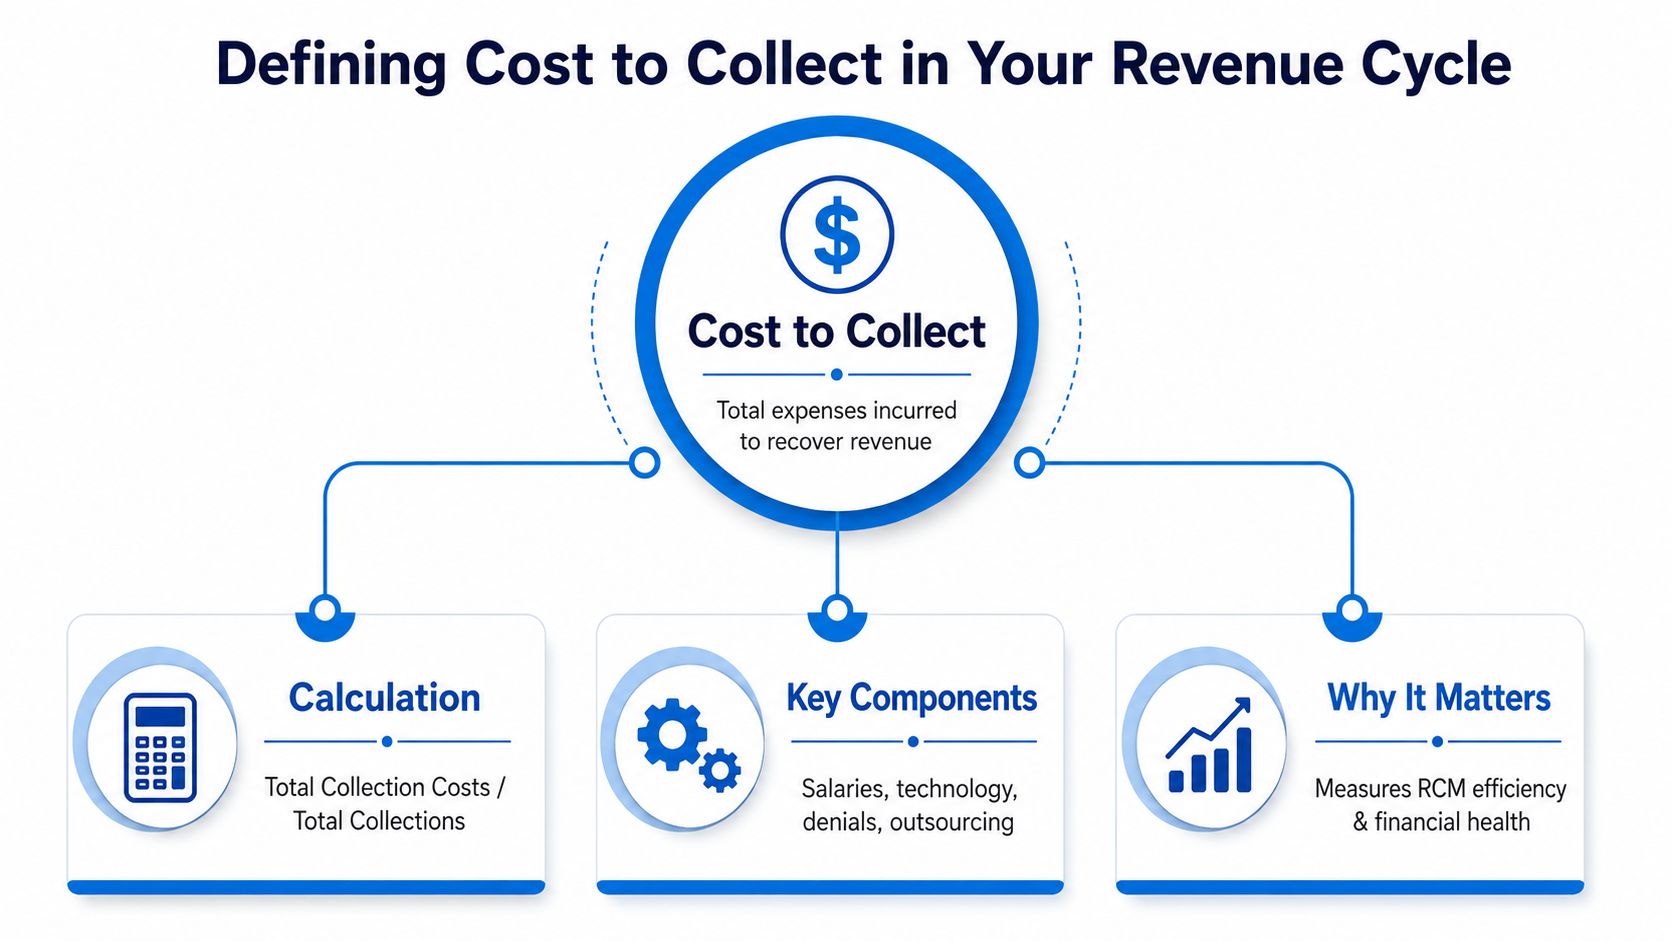
That percentage matters because it exposes operating friction that topline cash alone can hide. An organization can hold collections steady while its billing operation consumes more labor, more vendor spend, and more management attention. Over time, that compresses margin.
The metric is also directional. A rising result usually points to one of two conditions, and often both: the work required to collect each dollar is increasing, or the underlying process is producing more preventable rework. Executives should read it as a productivity signal across the revenue cycle, not as an isolated billing statistic.
What belongs in the numerator and denominator
The numerator is total revenue cycle cost. For most provider organizations, that includes the direct expense of patient access, eligibility verification, prior authorization support, coding, charge entry, claim submission, denial management, payment posting, patient collections, relevant software, clearinghouse fees, and outsourced revenue cycle services. If the cost exists because the organization is trying to convert accounts receivable into cash, it generally belongs in the numerator.
Typical components include:
- Labor expense for registration, eligibility, coding, billing, follow-up, denial review, and payment posting
- Technology expense for practice management systems, claim editing tools, clearinghouse services, and workflow software
- Vendor expense for outsourced billing support, early-out services, agency placements, or specialized RCM functions
- Direct overhead tied to the collection operation
The denominator is total collections, usually net patient service cash collected during the period. That choice matters. Gross charges make the ratio look artificially low and tell leadership very little about operational efficiency. Net collections tie the expense base to actual cash conversion, which makes the result more useful for board and executive review. It also pairs well with trends in net collection rate performance, since the two metrics answer different questions about the same cash engine.
A disciplined calculation produces a metric leadership can act on. A flattering calculation produces noise.
The why behind the metric sits in the process design. Front-end failures such as poor registration quality or missed eligibility checks increase downstream touches. Mid-cycle defects such as coding errors or charge lag create avoidable edits and denials. Back-end inefficiency in follow-up, underpayment review, or patient balance resolution extends staff time per account. Cost to collect captures the financial effect of all three.
A few rules keep the measure credible:
- Use consistent inclusion rules. Do not move categories in or out between periods to improve optics.
- Exclude unrelated corporate overhead. Broad administrative allocations can blur the operating signal.
- Match timing carefully. Expenses and collections should reflect the same reporting window.
- Document the methodology. Finance, operations, and revenue cycle leadership need one shared definition.
How to Accurately Calculate Your Cost to Collect
Build the calculation from your general ledger and billing data
The cleanest way to calculate cost to collect is to combine finance data with revenue cycle operating data. Start with all collection-related expenses for the period. Then divide that amount by net collections for the same period. Multiply by 100 to express the result as a percentage.
A fictional specialty clinic might organize the calculation like this.
| Sample Cost to Collect Calculation | Amount |
|---|---|
| Patient access labor | [Qualitative example only] |
| Coding and charge entry labor | [Qualitative example only] |
| Billing and follow-up labor | [Qualitative example only] |
| Denial management labor | [Qualitative example only] |
| Clearinghouse and software costs | [Qualitative example only] |
| Outsourced support fees | [Qualitative example only] |
| Total RCM expenses | [Add all included items] |
| Net collections | [Period cash collections] |
Because no verified numerical example was provided, the right approach is methodological rather than arithmetic. Add all valid revenue cycle expenses. Divide by net collections. Then convert the result into a percentage. That percentage is your cost to collect.
What matters most is consistency. If you include outsourced follow-up expense this quarter, include it next quarter. If your payment posting staff is centralized, make sure the allocation method doesn't swing unpredictably. The value of the metric comes from trend accuracy, not from one isolated report.
For leadership teams that also monitor reimbursement performance, it helps to compare cost to collect with related indicators such as net collection rate. The two metrics answer different questions. Net collection rate shows how much collectible revenue you're recovering. Cost to collect shows what it costs you to recover it.
Use a second lens for operational diagnosis
Percentage-based cost to collect is the right headline metric for executive review because it ties expense directly to collections. But it shouldn't be the only lens.
A second operational view is cost per claim. Even without using a numeric benchmark, this measure is useful because it exposes where work intensity differs across payers, service lines, or billing models. If one payer contract demands repeated status checks, more documentation, and more appeal work, the percentage view may blur that burden. A per-claim lens makes it easier to see.
Use the percentage metric when you want to answer questions like:
- Is the revenue cycle becoming more efficient overall
- Is the organization closer to benchmark performance
- Is administrative expense consuming too much collected revenue
Use a per-claim lens when you need to investigate:
- Which payer relationships create the most work
- Which specialties generate the most manual intervention
- Which teams or workflows require the highest staffing effort
Practical rule: Use the percentage to govern the enterprise. Use claim-level costing to find the operational root cause.
That distinction matters in board and management settings. A finance committee needs the enterprise view. A revenue cycle steering group needs enough granularity to isolate why one segment is producing a disproportionate amount of effort.
Interpreting Cost to Collect Revenue Cycle Benchmarks
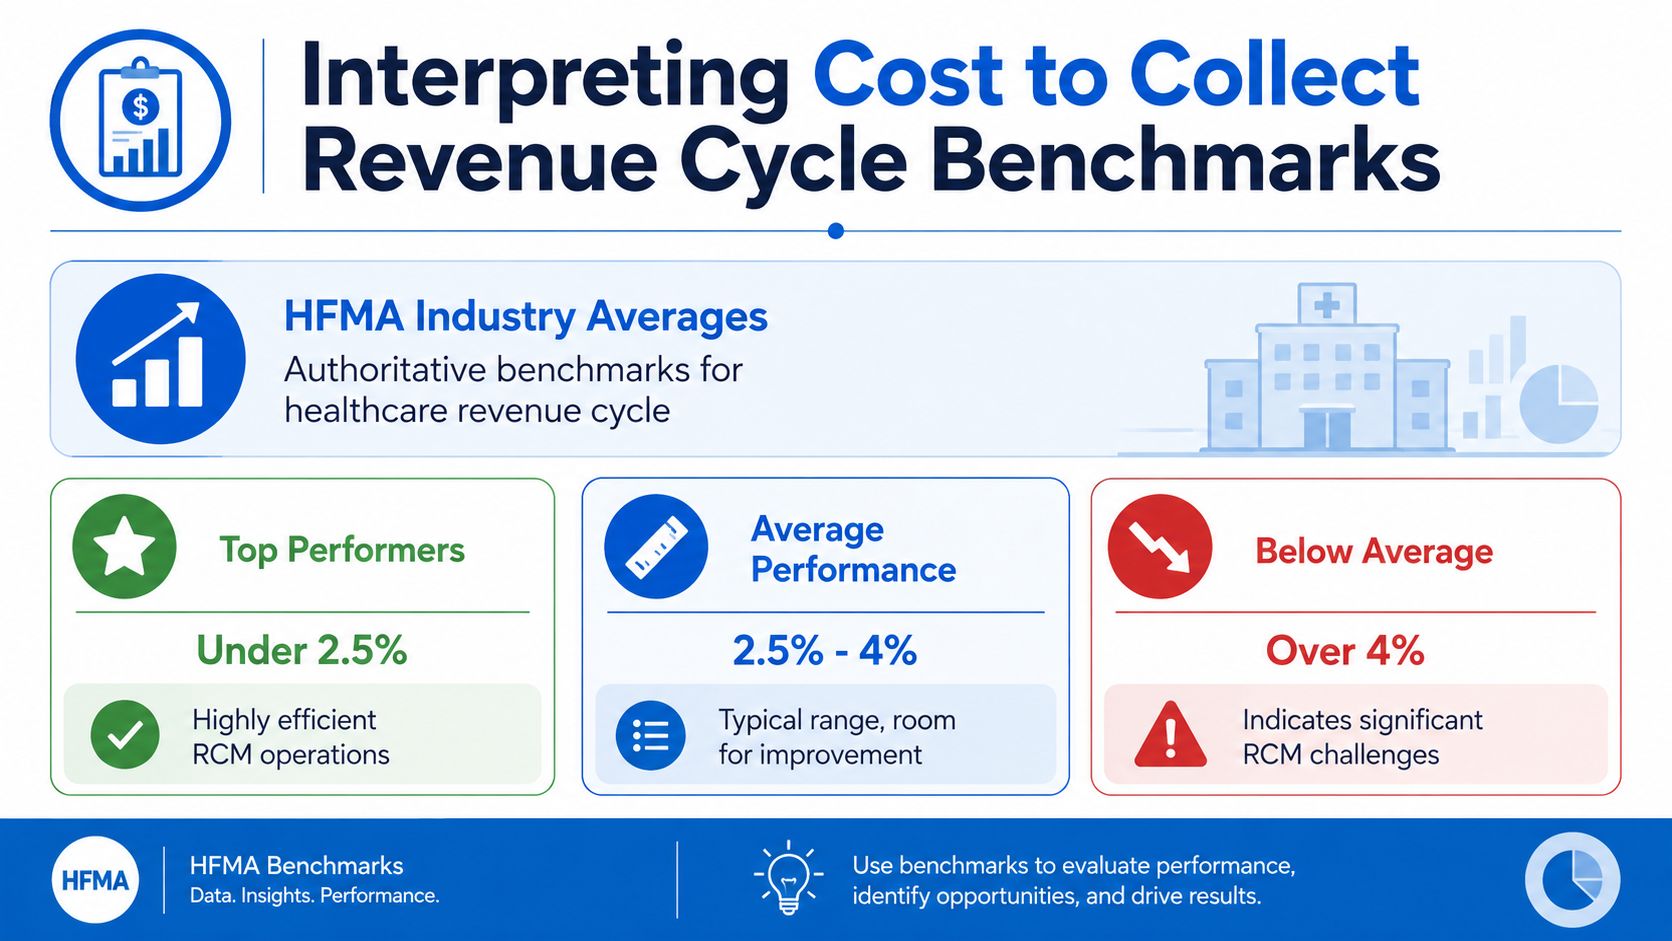
A one-point gap in cost to collect can erase a meaningful share of revenue cycle margin. For hospital leadership, that makes benchmark interpretation a management discipline, not a reporting exercise.
What the benchmark tiers signal
A benchmark only becomes useful when leadership understands what each range implies operationally.
| Performance band | Interpretation |
|---|---|
| At or below 2% | Best-in-class efficiency. Administrative effort is tightly controlled relative to collections, usually because rework is low and workflows are standardized. |
| 2% to 3% | Strong performance. Core processes are stable, but specific payer classes, locations, or service lines may still carry avoidable labor cost. |
| Around 3% to 4% | Functional but expensive. Margin is being consumed by manual follow-up, preventable denials, slow exception handling, or fragmented accountability. |
| Above 4% | A warning condition. Leadership should assume the revenue cycle is absorbing excess labor and vendor expense until the operating cause is identified. |
These ranges matter because cost to collect condenses multiple workflow failures into one financial outcome. A high result rarely comes from one isolated issue. It usually reflects repeated touches across the life of the account, starting at intake, continuing through claim production, and ending in extended follow-up or appeal activity.
That is the executive value of the metric.
It shows whether the organization is converting revenue with discipline. Days in A/R can improve while cost to collect worsens if teams are accelerating cash through heavier staffing, more outsourcing, or excessive account work. That tradeoff may help short-term cash performance, but it weakens long-term operating efficiency.
Leadership should read the benchmark as a question about process design. Low cost to collect usually indicates that front-end data is accurate, claim edits are controlled before submission, and back-end teams are working smaller exception queues. Higher ratios point to the opposite condition. More defects enter the system, more accounts require manual intervention, and more labor is needed to produce the same dollar of collections.
The practical takeaway is straightforward. Benchmarking tells you whether your revenue cycle is efficient relative to peers. Root-cause analysis tells you why. Organizations that segment this metric by payer, entity, and workflow stage get more value from it because they can connect the financial signal to a specific operating lever. That is where healthcare revenue cycle analytics becomes useful. It turns a broad benchmark into a targeted action plan.
If cost to collect stays elevated, the issue is rarely collections alone. The ratio often reflects front-end defects and mid-cycle rework that the back end is being forced to absorb.
The Primary Drivers of High Collection Costs

High cost to collect is usually a symptom of process failure, not a standalone collections problem. The ratio rises when the organization needs more labor, more vendor support, or more account touches to convert the same revenue into cash. For leadership, the useful question is where those extra touches are entering the revenue cycle and which operating levers will remove them.
The pattern usually starts upstream. A registration defect, a missing authorization, or a coding error rarely stays contained to one department. It creates follow-up work across patient access, HIM, billing, denial management, and patient collections. That is why organizations with disciplined best-practice revenue cycle management tend to lower cost to collect by preventing defects before the claim is billed.
Front-end failures create expensive downstream work
Front-end errors are some of the most expensive because they affect nearly every account that follows.
Common examples include:
- Registration errors that trigger claim edits, rebills, or manual correction after submission
- Weak eligibility verification that leaves coverage problems undiscovered until the payer rejects or denies the claim
- Incomplete benefit checks that create patient balance disputes and slow self-pay collections
- Authorization gaps that move accounts into retrospective review, rework, and appeal queues
These breakdowns raise cost to collect because they increase touches per account. Staff completes the original task, then spends additional time correcting avoidable defects. Productivity falls even when headcount stays flat.
Mid-cycle weaknesses raise claim handling cost
Mid-cycle performance determines whether the billing office receives a clean claim or a problem account. When charge capture, coding, and edit management are inconsistent, the business office absorbs the cost.
Watch for patterns like:
- Late or incomplete charge entry that delays billing and creates preventable edits
- Coding mismatches that trigger rejections, medical review, or payment delays
- Documentation gaps that require repeated provider queries or retroactive correction
- Claim edit overload because rules are being applied too late in the process
This is expensive for a simple reason. Rework in the middle of the cycle often looks like productive activity, but it does not add value. It consumes skilled labor to repair defects that should not have reached the billing stage.
A useful diagnostic principle is straightforward. If billing staff spends a large share of time fixing claim quality issues, the root cause usually sits in clinical documentation, charge entry, or pre-bill controls rather than in collections performance.
The following video provides a closer look at how mid-cycle inefficiencies increase manual work and push collection costs higher.
Back-end friction turns revenue into labor
Back-end friction is where the financial impact becomes visible. Labor hours increase, vendor costs rise, and management sees more effort spent per collected dollar.
The biggest drivers tend to be:
- Denial rework that forces teams into repetitive status checks, corrections, and appeal preparation
- Manual follow-up workflows spread across payer portals, phone queues, spreadsheets, and inboxes
- Poor prioritization that gives low-yield accounts the same effort as high-value recoverable balances
- Ineffective appeals management that consumes labor without a clear recovery strategy
Strong back-end teams can recover revenue. They cannot permanently offset broken intake and weak claim quality.
That conclusion matters for budgeting. Adding denial staff may improve short-term cash, but it often raises the cost base if upstream defects remain in place. Leadership teams that want durable improvement should track which costs originate at the front end, which are introduced mid-cycle, and which are merely absorbed by the back end.
Actionable Strategies to Lower Your Cost to Collect
Hospitals lower cost to collect when they reduce the number of touches required to turn a charge into cash. The metric improves fastest when leadership treats each handoff, correction, status check, and appeal as a cost event that should be prevented upstream, not absorbed downstream.
That changes the improvement agenda. The highest-return projects are usually the ones that remove repeat work across multiple teams, not the ones that make a single back-end function faster.
Prioritize interventions by avoidable rework
Start by asking a simple operating question: which defects create labor in more than one part of the revenue cycle?
Front-end failures usually meet that test first. Eligibility errors trigger claim edits, registration corrections, patient statements, and follow-up calls. Authorization gaps create low-yield retrospective work. Incomplete demographics slow clean claim submission and delay cash posting. A small defect at intake can create four or five separate work queues later.
Use that logic to set priorities:
- Automate eligibility and benefits verification. Earlier validation reduces preventable claim defects before staff time is spent on coding, billing, and follow-up.
- Standardize registration quality checks. Required fields, scripted workflows, and exception handling reduce downstream correction volume.
- Tighten authorization controls. Clear ownership, work queues by service date, and escalation rules prevent retrospective cleanup that consumes high-cost labor.
Mid-cycle improvements matter when they reduce preventable edits and rebills at scale.
- Strengthen claim scrubbing before submission. Clean claims cost less because they avoid avoidable touchpoints, including edit resolution, resubmission, and payer follow-up.
- Reduce coder and biller rework loops. If the same documentation questions appear every week, fix provider education, templates, or charge capture rules instead of reworking claims one at a time.
- Use payer-specific edit rules deliberately. Generic edits catch broad errors. Payer-specific logic removes denials tied to local filing rules, authorization requirements, and modifier usage.
Build management discipline around the metric
Lowering cost to collect requires operating discipline, not just new software.
Executives should review the metric the same way they review labor productivity. If collection cost is rising, determine whether the increase comes from more accounts worked, more defects per account, or more expensive staff performing low-complexity tasks. Those are different problems and they require different fixes.
A practical management model includes:
- Build a denial program around root cause. Track denials by source process, owner, preventability, and recovery yield.
- Segment follow-up by expected return. High-balance and high-probability recoveries should not compete for staff time with low-yield accounts.
- Redesign roles around skill level. Experienced staff should handle exceptions, appeals, and payer strategy, not repetitive status work.
- Use a formal operating framework. Organizations that sustain improvement usually align process redesign with revenue cycle management best practices, especially in intake accuracy, denial prevention, and payment workflow control.
One warning deserves board-level attention. Isolated fixes often improve a sub-metric while leaving total collection cost unchanged. A stronger denial team can recover cash but still raise labor expense if front-end errors continue. A new billing platform can speed claim release but fail to improve margin if charge capture remains inconsistent. Cost to collect falls on a lasting basis when front-end, mid-cycle, and back-end workflows produce fewer avoidable tasks per dollar collected.
Your Next Step with Clarity Health RCM
Leadership teams don't need another dashboard that confirms they have a revenue cycle problem. They need an operating partner that can trace collection cost back to the workflows causing it, then help redesign those workflows without disrupting cash flow.
That's where a full-service RCM partner becomes valuable. If your organization needs stronger front-end controls, support with Insurance Benefit Verification directly addresses one of the most common sources of avoidable denials. If charge and payment workflows are inconsistent, Billing Operations Support and Claim Status & Payment Posting improve execution where manual friction often accumulates. If the foundation itself is weak, Fee Schedule & Practice Management Setup can tighten billing accuracy before defects reach the payer.

The strategic value is not just outsourced labor. It's alignment. The organizations that improve cost to collect fastest usually connect front-end verification, billing operations, denial prevention, and payment posting into one accountable model. That's how finance leaders turn a benchmark into a margin improvement plan.
If your current cost to collect is outside the range leadership expects, or if you can't clearly explain which workflows are driving the expense, that's the right time for an external review. A disciplined assessment can show whether the issue is staffing design, process fragmentation, technology underuse, or a combination of all three.
Clarity can help you diagnose where revenue cycle cost is rising and build a practical plan to reduce it. Schedule a complimentary consultation with Clarity to review your current workflows, identify the likely drivers behind your collection costs, and get a customized solution designed to improve efficiency, accuracy, and profitability.
No responses yet